
East Lansing Wet Weather Resiliency Plan Virtual Open House
Welcome to the virtual open house for the East Lansing Wet Weather Resiliency Plan!

Welcome to the virtual open house for the East Lansing Wet Weather Resiliency Plan!
Click the arrows at the bottom of your screen to visit each section.
Use the navigation bar/menu to revisit any part of the meeting.
Leave your feedback any time on our Survey.

In recent years the City of East Lansing (City) has been impacted by multiple storm events that have resulted in flooding throughout many neighborhoods. Regional climate analyses for East Lansing indicates an increase in both the frequency and magnitude of short-duration, high-intensity precipitation events over the coming decades. In response to this growing risk, the City has initiated the development of a Wet Weather Resiliency Plan (WWRP or Plan). The Plan will provide a roadmap to reduce flood risk and create a safer, more flood-resilient city for residents, businesses, and visitors.
To inform the Plan, the City heard from community members through a series of engagement activities including in-person meetings and a survey to residents. These opportunities included options for residents to upload photos of flooding, ways to connect for immediate support, and provided educational information to help residents divert water away from their homes.
The City is now focused on prioritizing projects that will form the basis of future projects within the Wet Weather Resiliency Plan. The City hosted multiple focus groups with key stakeholders in November 2025 and June of this year.
Explore this Virtual Open House to learn more about vulnerable zones, how you can reduce flooding on your personal property, connect with the City, and provide feedback to support the City develop a Wet Weather Resiliency Plan that works for you!
The Wet Weather Resiliency Plan was envisioned by the City to be foundational in helping the community become more resilient to the changing climate conditions.
The Plan development process consisted of 11 total tasks, as shown on the right, that have been on-going since early 2024. This nearly two-and-a-half-year effort will conclude this fall. The community and stakeholders are currently being asked to provide feedback on the recommendations in the Plan related to flood risk reduction strategies, projects, costs, priorities and implementation efforts to inform the final plan. Feedback received will be incorporated into the final Plan, which will be presented for adoption by the City Council in September.
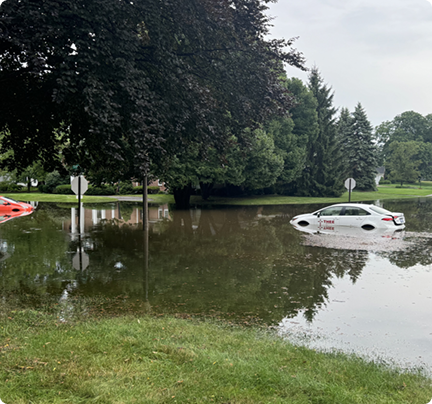
In August 2021, 7.22 inches of rainfall fell within the City in the span of 5 to 6 hours—an event deemed to be as rare as a 1,000-year storm. The event resulted in 227 reported incidents of flooding. Just a month later, in September 2021, the City saw 25 more reports of flooding, this time from a mere half-hour downpour of 1.25 inches. In 2024 two more severe rain events, one in June and another in July, would cause widespread flooding. The event in June dropped 5.2 inches in six hours, while the event in July, which was even more intense dropped 6.2 inches in three hours.
These events are a reminder of an uncertain future climate with the potential for increasing frequency of short but intense storms hitting our community. Rainfall like this is not unique to East Lansing as communities across the nation are grappling with the challenges of more frequent, high-intensity storms. In a proactive response, the City has initiated the development of a Wet Weather Resilience Plan (Plan) to find ways to mitigate flooding and safeguard its residents and visitors. As part of the Plan, the City and its consultant HDR have developed The City of East Lansing Changing Precipitation Conditions Report that incorporates the latest scientific analysis using historic and future climate change rainfall. The findings within the report will ensure that future investments as part of the Plan are functional and resilient to increasing rainfall patterns.
Historical Trending Analysis. The report analyzed historical rainfall trends using long-term rainfall data from 1949 to 2023 from the Lansing Airport. Over this period the trendline of annual precipitation in the East Lansing region increased approximately 30 percent (from 27 to 35 inches of rain). Likewise, the historical trends indicate that the intensity of rain events have also increased. For high intensity 1-hour duration rain events, historic trends indicate an almost 75 percent increase in rainfall from 1949 to 2023.
Engineering Design Storm Analysis. Engineers rely on prescribed engineering design storms to “right size” stormwater drainage systems. These events are the so called “10-year” or “100-year” rain events. Analysis within this report found that the engineering design storm estimates specifically for East Lansing developed by the National Oceanic and Atmospheric Agency, commonly referred to as Atlas-14 Rainfall Estimates, are over 10 years out of date. The engineering design storms were updated for the City using more recent rainfall data. Analysis indicates that by including more recent rainfall data the engineering design storm for the 1 though 25 year rain events all increase, indicating that smaller, more intense, and more frequent rain events are increasing in size.
Representative Storm Analysis. Using high resolution radar rainfall scans, twelve of the largest rain events that have impacted East Lansing in the past 30 years were analyzed for spatial patterns and timing of rainfall. Analysis from these historic rain events, referred to as “representative storms”, indicates that storms that result in flooding in East Lansing are often 3 to 18 hours in duration. Most of the rainfall of these events happens in fewer than 2 to 3 hours, with one hour peak intensities overwhelming City drainage system capacities. This indicates that short duration rain events should be a focus for the Plan.
Future Climate Change Analysis. The impact of future climate change was determined using state of the practice Global Climate Models specific to East Lansing. Climate change projections were determined for the years 2035, 2050, 2070, and 2100. Under a medium global climate change scenario, rainfall estimates are predicted to increase by eight percent by 2100. Under a high global climate change scenario, rainfall estimates are predicted to increase by 20 percent by 2100.
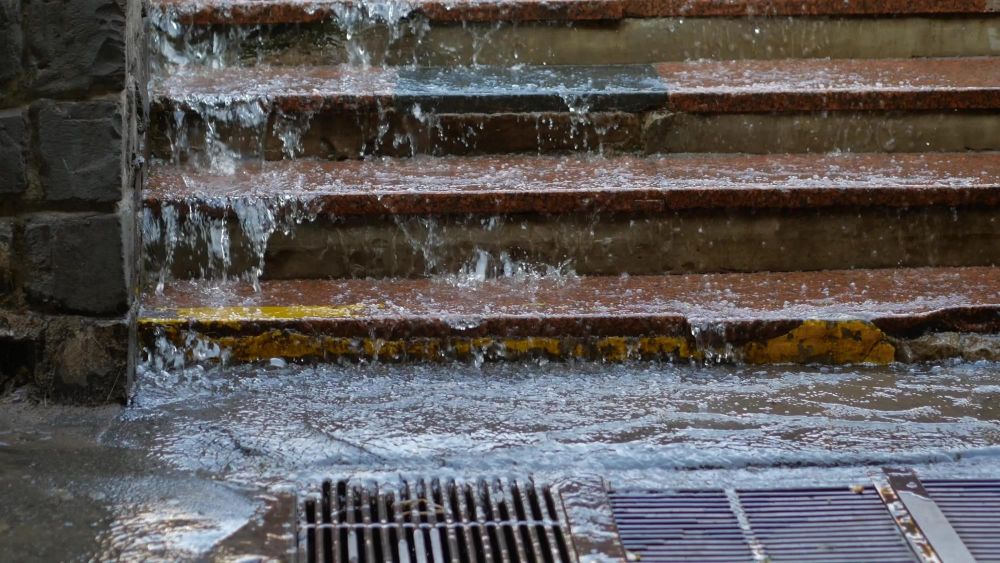
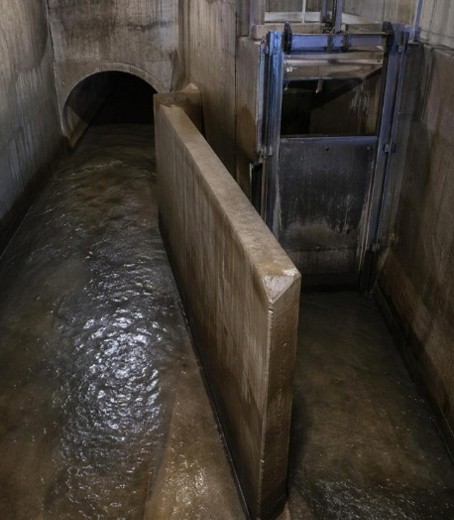
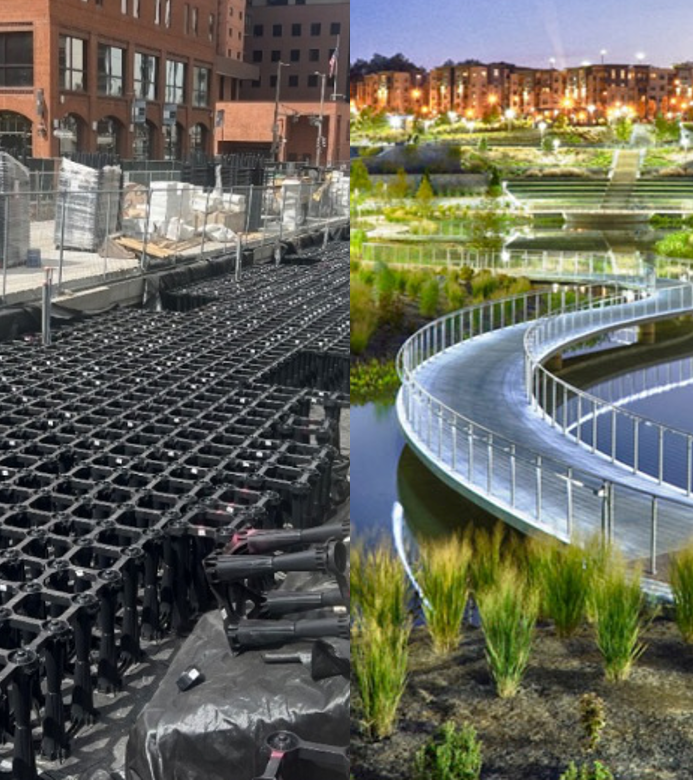
A mixture of strategies are needed to increase the Level of Service of the drainage system. Four key flood risk mitigation strategies were considered in the development of projects. Within the combined sewer system areas, sewer separation to remove storm water, is the City’s preferred strategy over combined sewer upsizing. Additionally, opportunities to add green infrastructure storage systems to slow down the flow of water to the Red Cedar River were incorporated where land is available. Remaining combined sewer systems will be evaluated after separation to determine if remaining bottlenecks still need to be addressed. This will be done in future phases.
How This Strategy Works
How This Strategy Works
How This Strategy Works
How This Strategy Works
Community representatives indicated a strong desire for green infrastructure to be incorporated into the alternatives. As a result, several opportunities for green infrastructure and storage facilities were identified, mainly from available City-controlled properties. In general, privately owned parcels were not studied extensively for green infrastructure and storage opportunities because of a lack of property control to easily implement projects.
The potential green infrastructure and storage are located at:
Rendering of what the aboveground storage at Harrison Meadows park, west of Abbot road, could look like.
Rendering of what an underground storage would look like at Valley Court Park. The surface above the storage would be fully restored with grass, trees, and plants following construction.
Within the High-ranking flood areas of concern, concept level flood mitigation project alternatives have been identified and evaluated. Evaluations followed a two-step process:
Identify conceptual flood mitigation project alternatives within each area and insert into the flood model to understand flood reduction benefits.
Using the results from Step 1, score and rank each project alternative using a project prioritization framework. Select the highest-ranking projects for inclusion into the recommended Plan.
The Project Prioritization Framework was developed in conjunction with the City and public stakeholders who consist of various neighborhood community groups and non-City government entities. The Project Prioritization Framework consists of eight (8) criteria for evaluating projects as part of the Plan. These criteria are shown below. The relative importance of each criteria, referred to as its “Weight”, was determined by using a pairwise scoring approach. A pairwise scoring approach allows the City to understand which criteria matters most to the community when it comes to evaluating projects. A higher weight means that criteria is more important. For example, the highest weighted criteria is “Improved Drainage” with a Weight of 16.5%, while the lowest weighted criteria is “Ease of Constructability” with a Weight of 7.9%. This means that Improved Drainage carries over double the importance as compared to Constructability when evaluating and selecting projects that will be included in the recommended Plan.
In addition to the Criteria, the City has stressed the importance of environmental justice and equity as part of the overall development of the Plan. Analyses have incorporated social vulnerability using publicly available US Census metrics. This data was analyzed to understand where the most vulnerable areas in the City are located and will be factored into the project prioritization and selection.
How do you feel about the Criteria and weights? Please consider submitting feedback by filling out the Survey by clicking on the Feedback webpage on the left panel.
The degree to which drainage is improved to reduce flood risk.
Weight: 16.5%
How aligned the Plan is with the City’s Combined Sewer Overflow elimination goals or ability to design project with water quality treatment features.
Weight: 15.5%
Focusing the City on projects that impact a higher total number of people or a high-visibility project.
Weight: 14.9%
How aligned with City’s resiliency initiatives will relate to green stormwater management and infrastructure.
Weight: 13.0%
Focusing the City on projects that will reduce unnecessary impervious surfaces (cement or other non-draining surfaces).
Weight: 11.8%
Focusing the City on projects that will reduce unnecessary impervious surfaces (cement or other non-draining surfaces).
Weight: 11.8%
How easy it is to maintain.
Weight: 9.4%
How easy is it to build and implement.
Weight: 7.9%
Several non-structural strategies are under consideration by the City to complement the structural strategies (projects) recommended. These strategies target primary needs such as funding and impervious-surface reduction, both of which were topics of discussion during the stakeholder focus groups.
A stormwater utility study would explore creating a stormwater utility to support the implementation of both structural and nonstructural strategies. This directly addresses funding and has proved to be successful in other areas impacted by surface flooding. Inclusion of a stormwater credit program for property owner fee reductions should be considered to encourage stormwater management best practices to reduce runoff and/or improve water quality.
Continue the City’s existing Property Owner Assistance Program for Basement Backup Protection that provides financial reimbursement for installation of backflow preventers.
Review and modify current design and development standards for streets, bike lanes, sidewalks, and pathways that create additional impervious surfaces to incorporate current best practices for reducing hard-surface construction and incorporating green infrastructure.
A pay-in-lieu program allows developers to satisfy stormwater requirements through a fee payment when on-site compliance is impractical, while providing the City with a dedicated funding source for larger, watershed-scale stormwater improvements that can deliver equivalent or greater benefits.
Updating post-construction standards (e.g., design storm, small site development, minimum requirements/credits) for resiliency.
This strategy would explore implementing a program specifically aimed at reducing the amount of impervious surfaces. More green infrastructure would improve drainage across the City.
Partnering with other City departments and nonprofit groups in the area would provide benefits across several areas, such as wetlands, trails, parks, etc.
Providing additional staff and technical resources to residents and business owners on private property flood risk mitigation strategies.
Develop enhanced GIS mapping of private drainage system infrastructure built by developers to document new systems and promote their active asset management and coordination with adjacent systems.
Prioritize the proactive implementation of active stormwater management measures on City-controlled sites when other improvements are planned and implemented.
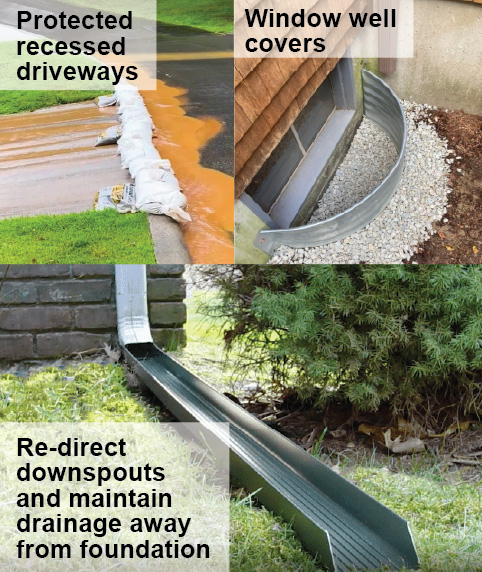
While the City plans and prioritizes projects to address flooding in public systems, residents can also take steps to reduce contributions to the storm sewer system and their homes.
All of these stormwater tips can help protect your home from flooding, either directly by preventing the pooling of runoff in your yard, or indirectly by reducing your contribution to the storm sewer and therefore lessening the burden on the system. But there are other ways to protect your home against water damage from heavy rain.


It’s also important to share these ideas with your neighbors and support investment in our local infrastructure. If residents, businesses, and municipalities work together to reduce stormwater runoff and improve both our public and private wet weather infrastructure, we can be better prepared for intense rain events in the future. Visit MyWatersheds.org to learn about how communities in Greater Lansing and throughout the country are managing their stormwater challenges and how you can help at home.

It’s also important to share these ideas with your neighbors and support investment in our local infrastructure. If residents, businesses, and municipalities work together to reduce stormwater runoff and improve both our public and private wet weather infrastructure, we can be better prepared for intense rain events in the future. Visit MyWatersheds.org to learn about how communities in Greater Lansing and throughout the country are managing their stormwater challenges and how you can help at home.
Basement Flooding and Sewer Backup
Information
Basement Flooding & Sewer Backup Information | East
Lansing, MI - Official Website
Basement Flooding Brochure
Basement Flooding Brochure PDF
Sewer Backup Dos and Dont
Sewer Backup Do's & Don'ts | East Lansing, MI -
Official Website
Heavy Rains and Backup Drains
Heavy Rains and Backed-up Drains PDF
 1800 E State Rd, East Lansing, MI 48823
 Phone:
517-337-9459
Phone:
517-337-9459
 Public Works & Environmental Services | East Lansing,
MI - Official Website
Public Works & Environmental Services | East Lansing,
MI - Official Website








 Funding
 Asset Management

 Private Property Protection
 Resiliency

 Impervious-Surface Reduction
 Additional Green Infrastructure